Reconciling the Great Divergence
Goldman Sachs, PwC, McKinsey, and Acemoglu all model AI's economic impact and arrive at wildly different numbers. Why the divergence?
Listen while you read
Goldman Sachs says AI could add $7 trillion to global GDP. MIT economist Daron Acemoglu says the near-term impact is closer to 0.5%. PwC projects $15.7 trillion in additional economic value by 2030. McKinsey puts annual productivity gains at $2.6–4.4 trillion.
These numbers are not slightly different estimates of the same thing. They reflect fundamentally different assumptions about what AI is, what it will be able to do, and when. Understanding the divergence matters more than knowing which number is right — because the divergence tells you exactly where the uncertainty lives.
Why the Numbers Are So Far Apart
The optimistic forecasts (Goldman, PwC, McKinsey) model AI as a general-purpose technology analogous to electricity or the internet. Their methodology extrapolates from historical GPT precedents: new general-purpose technologies produce compounding productivity gains over 10–20 year periods, and the gains eventually show up in GDP even if there’s a lag.
Goldman’s model is built on labor automation: AI can automate 25–46% of current work tasks (depending on occupation), which translates into productivity gains that flow through to output and real wages. PwC layers in a “GDP multiplier” that compounds AI-driven productivity with innovation spillovers and behavioral changes in consumption. McKinsey identifies specific domains — customer service, software development, knowledge work — and estimates how much productivity improvement is achievable in each.
Acemoglu’s model challenges the methodology. His objection isn’t that AI is useless; it’s that the optimistic forecasts assume a pace and scope of task automation that the evidence doesn’t support. His analysis of which tasks are actually cost-effectively automatable with current AI concludes that roughly 5% of tasks currently performed by workers are plausible near-term targets. At realistic adoption rates, that translates to 0.5% total factor productivity growth over a decade — meaningful, but orders of magnitude smaller than the headline projections.
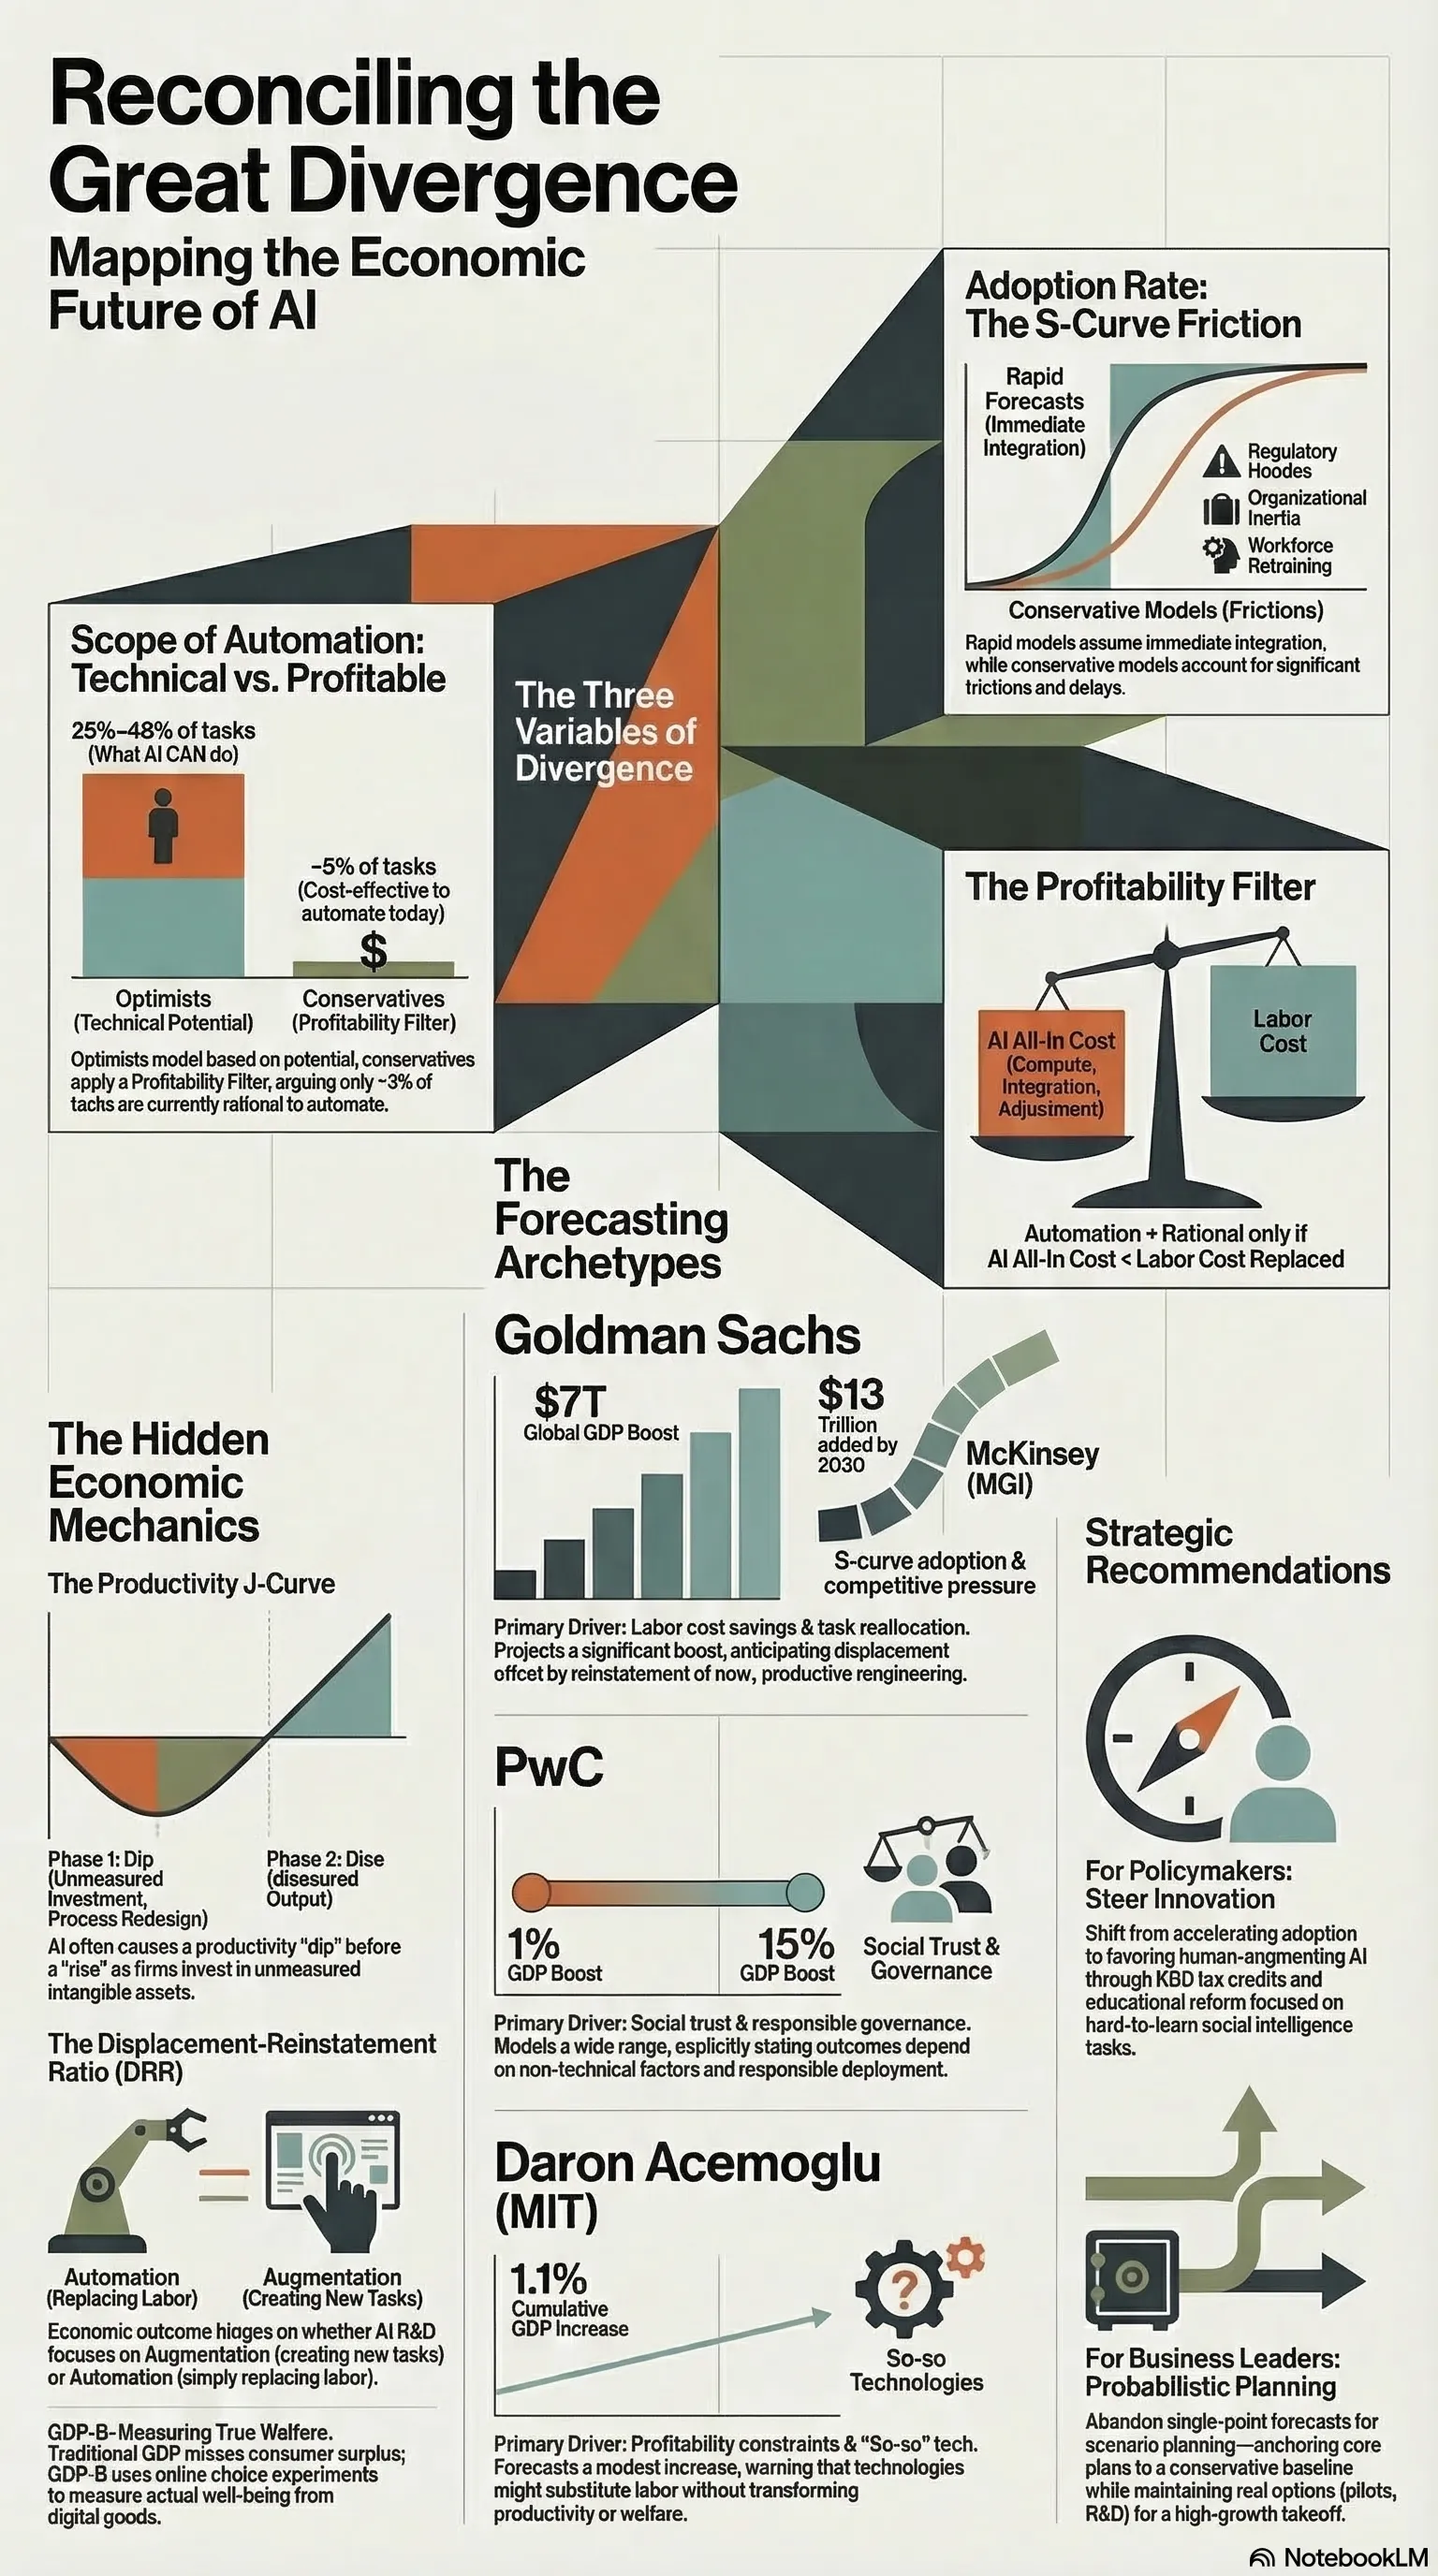
The divergence comes down to three variables:
Scope of automation. Goldman models automation as touching large swaths of cognitive work. Acemoglu models it as touching a narrow slice. Both are working from the same technology; they disagree about what “automatable” actually means in practice.
Adoption rate. Optimistic models assume rapid, economy-wide adoption. More conservative models apply significant friction discounts for regulation, organizational inertia, workforce resistance, and the plain difficulty of integrating new systems into existing processes.
The profitability filter. This is the most underappreciated variable. AI deployment requires capital investment, ongoing compute costs, and organizational change. For any given task, automation is only economically rational if the cost of the AI system is less than the labor it replaces. Many tasks that are technically automatable aren’t profitably automatable at current infrastructure costs.
What They Actually Agree On
Strip away the headline numbers and the methodological debates, and a clearer picture emerges. The forecasters actually agree on quite a lot:
The gains will be unevenly distributed. Every model — optimistic and pessimistic — finds that AI productivity gains concentrate in specific sectors (knowledge work, software, customer-facing services) and within those sectors, in the workers who adopt and complement AI rather than compete with it. The distribution of gains across occupations, firms, and geographies is a political economy problem that the forecasters agree is significant and disagree about whether policy can address.
There’s a substantial lag between capability and economic impact. McKinsey’s models consistently show a 5–10 year gap between when technology becomes technically available and when productivity gains show up in GDP statistics. This isn’t unique to AI — it was true of computers, of the internet. The “productivity paradox” (you can see the technology everywhere except in the productivity statistics) has historically resolved itself, but not quickly.
The pace of adoption is the critical variable. Whether AI adds $1 trillion or $15 trillion over the next decade depends less on what AI can do than on how fast organizations actually change their workflows, retrain their workforces, and integrate new tools into production. This is a sociological and organizational question as much as a technical one.
Measurement is genuinely hard. GDP statistics were built to measure industrial output. Productivity improvements that take the form of faster information retrieval, better decision support, or reduced administrative friction show up slowly and partially in standard metrics. All the forecasters hedge significantly on measurement methodology.
What This Means for Decisions
The uncertainty isn’t a bug in the forecasts — it’s the correct output. We’re in a period where the technology is demonstrably real and demonstrably capable, where early adopters are seeing genuine productivity gains, and where the economy-wide effects are too early to measure and depend on adoption dynamics that haven’t resolved.
The practical implication: act on the certainty, hedge against the uncertainty. The certain things are that AI changes the cost structure of cognitive work, that the gains concentrate in specific domains and specific workers, and that adoption friction is real. The uncertain things are the magnitude, the timeline, and the distributional effects.
For organizations, this means investing in AI capability now (the downside of moving too slowly is real) while treating headline GDP projections as scenarios rather than forecasts. For policymakers, it means accepting that the distributional consequences are politically important regardless of the aggregate magnitude — even a 0.5% productivity gain unevenly distributed creates losers who will demand policy responses.
The divergence in the forecasts is itself useful data. It tells you exactly which assumptions to stress-test.
This analysis draws on research conducted as part of the Orchestrix strategic research project. The full probabilistic framework, methodology comparison tables, and scenario models are in the technical report.